1
2
3
4
5
6
7
8
9
10
11
12
13
14
15
16
17
18
19
20
21
22
23
24
25
26
27
28
29
30
31
32
33
34
35
36
37
38
39
40
41
42
43
44
45
46
47
48
49
50
51
52
53
54
55
56
57
58
59
60
61
62
63
64
65
66
67
68
69
70
71
72
73
74
75
76
77
78
79
80
81
82
83
84
85
86
87
88
89
90
91
92
93
94
95
96
97
98
99
100
101
102
103
104
105
106
107
108
109
110
111
112
113
114
115
116
| import numpy as np
import cv2
from numpy.random import uniform, normal, exponential, rayleigh
import matplotlib.pyplot as plt
def uniform_noise( f, scale ): # 均勻雜訊
g = f.copy( )
nr, nc = f.shape[:2]
for x in range( nr ):
for y in range( nc ):
value = f[x,y] + uniform( 0, 1 ) * scale
g[x,y] = np.uint8( np.clip( value, 0, 255 ) )
return g
def gaussian_noise( f, scale ): # 高斯雜訊
g = f.copy( )
nr, nc = f.shape[:2]
for x in range( nr ):
for y in range( nc ):
value = f[x,y] + normal( 0, scale )
g[x,y] = np.uint8( np.clip( value, 0, 255 ) )
return g
def exponential_noise( f, scale ): # 指數雜訊
g = f.copy( )
nr, nc = f.shape[:2]
for x in range( nr ):
for y in range( nc ):
value = f[x,y] + exponential( scale )
g[x,y] = np.uint8( np.clip( value, 0, 255 ) )
return g
def rayleigh_noise( f, scale ): # 瑞雷雜訊
g = f.copy( )
nr, nc = f.shape[:2]
for x in range( nr ):
for y in range( nc ):
value = f[x,y] + rayleigh( scale )
g[x,y] = np.uint8( np.clip( value, 0, 255 ) )
return g
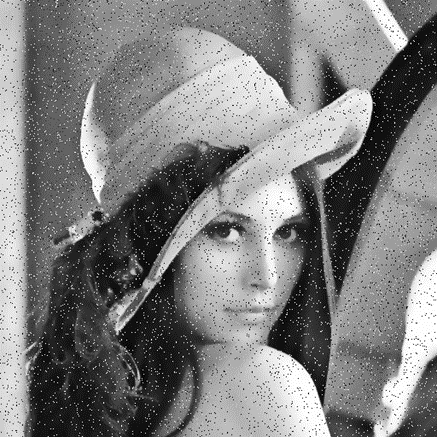
def salt_pepper_noise( f, probability ): # 鹽與胡椒雜訊
g = f.copy( )
nr, nc = f.shape[:2]
for x in range( nr ):
for y in range( nc ):
value = uniform( 0, 1 )
if value > 0 and value <= probability / 2:
g[x,y] = 0
elif value > probability / 2 and value <= probability:
g[x,y] = 255
else:
g[x,y] = f[x,y]
return g
def PSNR( f, g ): # PSNR
nr, nc = f.shape[:2]
MSE = 0.0
for x in range( nr ):
for y in range( nc ):
MSE += ( float( f[x,y] ) - float( g[x,y] ) ) ** 2
MSE /= ( nr * nc )
PSNR = 10 * np.log10( ( 255 * 255 ) / MSE )
return PSNR
def histogram( f ):
if f.ndim != 3:
hist = cv2.calcHist( [f], [0], None, [256], [0,256] )
plt.plot( hist )
else:
color = ( 'b', 'g', 'r' )
for i, col in enumerate( color ):
hist = cv2.calcHist( f, [i], None, [256], [0,256] )
plt.plot( hist, color = col )
plt.xlim( [0,256] )
plt.xlabel( "Intensity" )
plt.ylabel( "#Intensities" )
plt.show( )
def main( ):
print( "Image Degradation with Noise Model" )
print( "(1) Uniform Noise" )
print( "(2) Gaussian Noise" )
print( "(3) Exponential Noise" )
print( "(4) Rayleigh Noise" )
print( "(5) Salt and Pepper Noise" )
method = eval( input( "Please enter your choice: " ) )
if method >= 1 and method <= 4:
scale = eval( input( "Please enter scale(e.g., 20): " ) )
elif method == 5:
probability = eval( input ( "Please enter probability(e.g., 0.05): " ) )
else:
print( "Noise model not supported!" )
exit( )
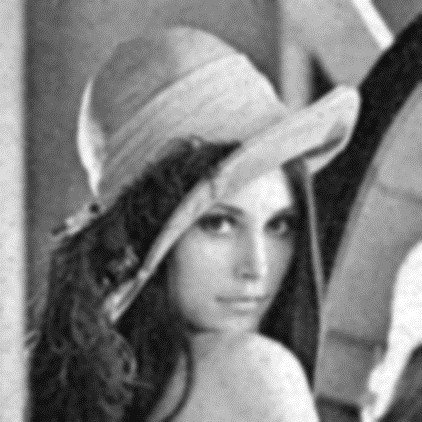
img1 = cv2.imread( "gaussian_noise_15.bmp", -1 )
if method == 1:
img2 = uniform_noise( img1, scale )
elif method == 2:
img2 = gaussian_noise( img1, scale )
elif method == 3:
img2 = exponential_noise( img1, scale )
elif method == 4:
img2 = rayleigh_noise( img1, scale )
else:
img2 = salt_pepper_noise( img1, probability )
print( "PSNR =", PSNR( img1, img2 ) )
cv2.imshow( 'lenna', img1 )
cv2.imshow( 'Uniform Noise_10_test', img2 )
cv2.imwrite("Uniform Noise_10_test.bmp", img2 )
histogram( img2 )
if __name__ == '__main__':
main()
cv2.waitKey( 0 )
cv2.destroyAllWindows( )
|
